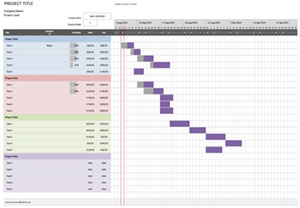
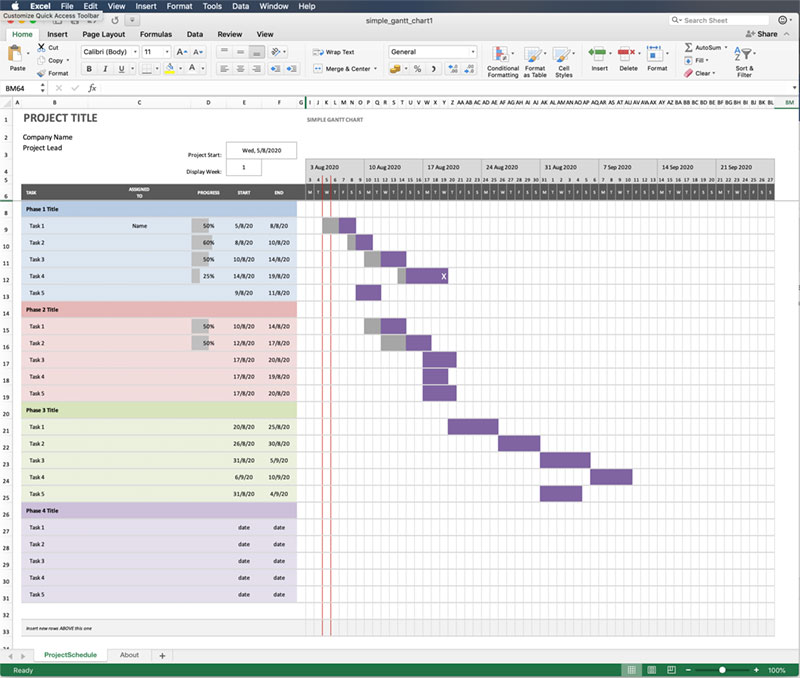
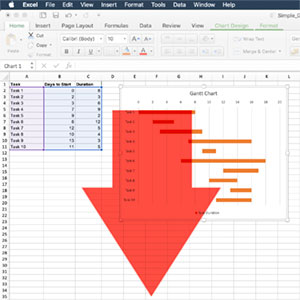
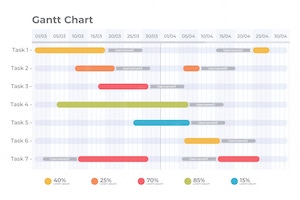
The Gantt Chart is a chart that displays the progress of a project. It is used to track the progress of a project and to provide an indication of how long it will take to complete the task.
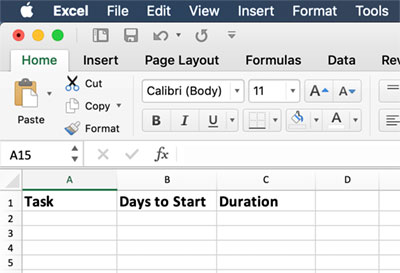
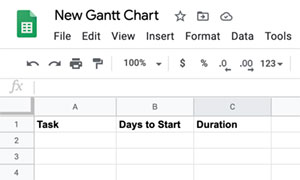
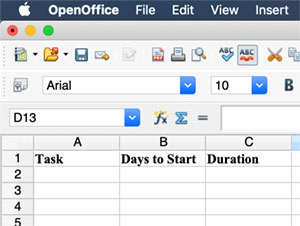
Gantt Charts are also known as Project Progress Charts or Progress Charts. The chart is created by using a spreadsheet and then displaying the data in a chart format. The data can be either text or numbers.
Gantt Charts are a popular and effective way of managing interrelated project tasks and offer many advantages.
The Gannt Chart gives Clarity over multiple project tasks, timelines and the interdependencies between them.
Communication between project team management and members is enhanced by having a central Gantt Chart that is updated with the current project tasks.
The Gantt Chart can help Motivate team members by seeing how their own input is effecting project development.
Having an overview of the sequence of project tasks helps Coordination for project management and allocation of both manpower and resources.
Understanding, through the use of a Gantt Chart, the interdependent roles of individuals and teams can enhance Creativity in problem solving.
Time Management is enhanced by better scheduling of tasks, and an understanding of the impact of delays in one task on overall project development.
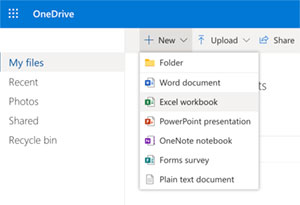
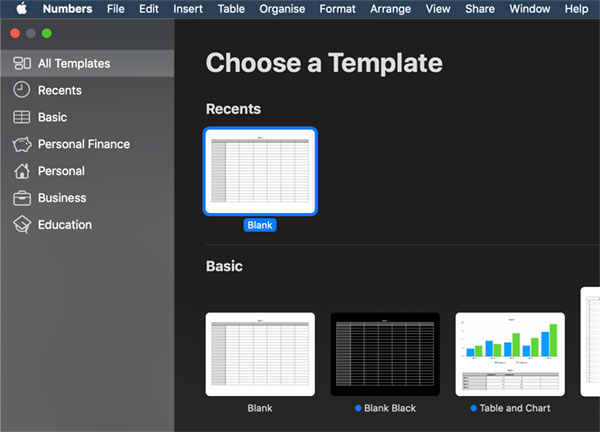
A Gantt Chart based on software offers Flexibility in updating the timeline, dates, tasks, and revising the project schedule in light of unexpected events.
Having an overview of the project tasks improves overall Manageability of complicated projects that need many external resources.
The Gantt Chart improves Efficiency by making project managers and team members aware of when they are required for specific tasks, and when they can be allocated elsewhere.
Accountability is enhanced by recording the history of the project and making clear where delays, or improvements, in tasks have occurrd, the effect they have on other project tasks, and the effect on overall project delivery.