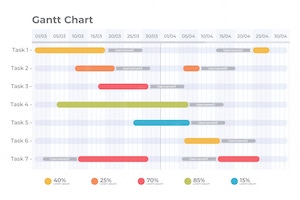
 Creating a Gantt chart is an excellent way to visualize the progress of a project over time. With a Gantt chart, you can see which tasks are taking up more time than others, what stage each task is in, and — most importantly — when you need to take action if something is going awry. Put simply, a Gantt chart is a type of bar chart that illustrates the duration of individual tasks within a larger project. These graphs are typically used for projects that involve parallel processes with pre-defined start and finish dates. However, they can be applied to almost any process that has sequential steps. A Gantt chart helps visualize how much time different sub-projects take up as well as the dependencies between them. This makes it easier to plan your project and manage its progress by seeing what needs to happen next at all times.
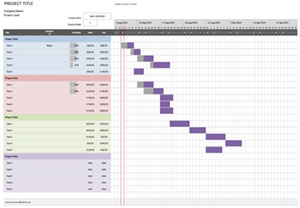
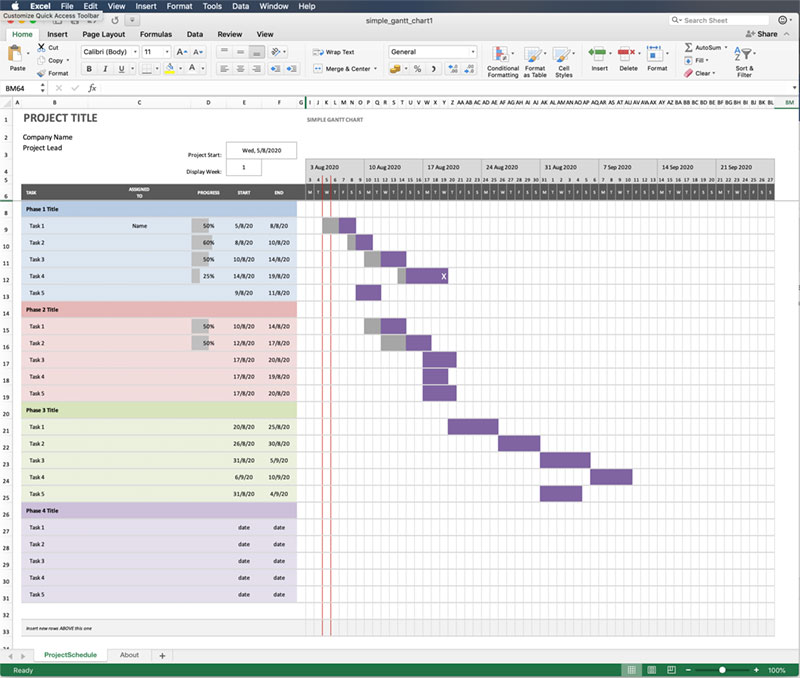
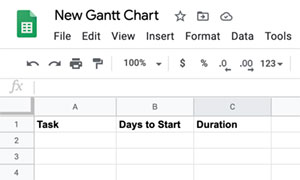
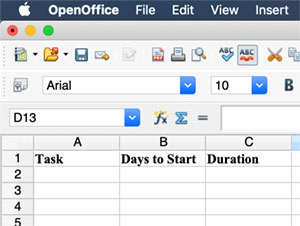
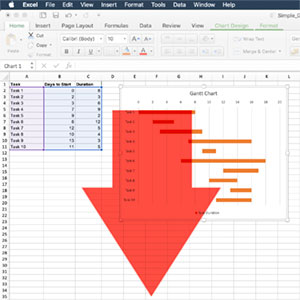
Create a Gantt Chart in Excel
Let’s get started with creating a Gantt chart in Excel. You can choose any software you want, but Excel is a great choice for most people. This is because a Gantt chart is a list of tasks with their start and end dates. If you have all of this information at your fingertips, you might as well make it visible to everyone involved. Gantt charts are extremely versatile. You can use the same chart for a variety of different types of projects. It is simple enough to make sense for small projects with just a few people involved, but also robust enough for larger projects that require a lot of collaboration between teams.
Step 1: Plan your project
Before you start building your Gantt chart, you’ll first need to determine the scope of your project. This will enable you to create a detailed overview of all tasks required to achieve the identified goals. The most important thing at this stage is to set the right expectations. You’ll need to determine when the project will end, who will be involved in it, and what the expected outcome will be. At this stage, don’t worry about the specific details of each task. Instead, focus on the big picture — you can go into detail later. Gantt charts are perfect for managing larger projects because they can be applied to almost any scenario that has a start and finish date and multiple parallel processes. That being said, the best Gantt chart to use for your project will depend on the type of work you’re doing — and what length of time it will take.
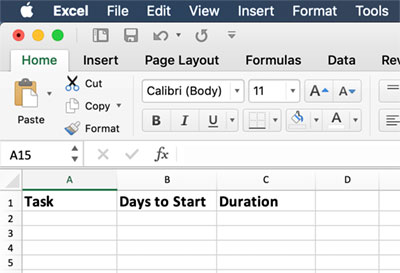
Step 2: Determine time frames and build a task list
After you’ve planned your project, you’ll be able to break down each task into a more manageable timeline. This will enable you to group similar tasks and determine their duration. You can then create a task list containing all of your tasks. Choose a consistent time frame for each task. You can choose between days, weeks, or months. It is best to choose either the same time frame for all tasks or a combination of time frames that make the most sense for your project. A good rule of thumb is to assign each task a duration that is as close to reality as possible. This may mean that you’ll have to make some adjustments as you go along.
Step 3: Calculate the total duration of each task
Now that you have a list of tasks and their time frame, you can calculate the total duration of each task. This will enable you to see at a glance how much time each task takes up and how the different tasks interact with each other. There are multiple ways to calculate the duration of your tasks. Some people like to use the “80/20 rule” and put their tasks in the “easy” or “difficult” categories. Others prefer to use the “PERT” formula. For the “PERT” formula, you’ll need to know the duration of each task, the number of resources working on it, and their availability. If some of the tasks are dependent on others, you’ll need to consider this as well.
Step 4: Sum up the durations of all tasks
Once you’ve calculated the duration of each task, you can add them up to get the overall project duration. The project duration will let you know how much time you’ll need to complete the project. It is a good idea to add a 10 – 20% buffer to the total duration. This will give you enough time to deal with unforeseen circumstances or issues that may arise. In addition, you can get further insight into your project by adding up the durations of all tasks again at a later stage. This will enable you to see where you can save time and effort. When adding up the durations of all tasks, don’t forget to take the duration of the project overview into account as well. This will enable you to see how long your project will take from start to finish.
Step 5: Determine the start and end dates
When you’ve added up the durations of all tasks, you’ll be able to see the start and end dates of your project. This will enable you to see whether you have enough time to complete the project. If you’re working on a large project, it is a good idea to break it down into smaller milestones. This will make it easier to stay on track and identify what needs to happen and when. You can also break down your project into different phases, such as design and development. Having a clear start and end dates will help you to stay focused. This way, you’ll know exactly when you need to accomplish certain tasks. In addition, you can use these dates to help you determine whether the project is realistic.
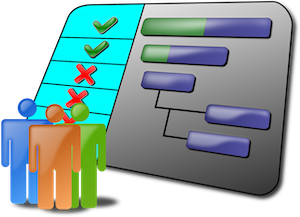
Step 6: Assign people to tasks and check again
Once you have all of your tasks listed, with their start and end dates, and the required resources, you can assign them to specific people. You can use this information to create a timeline that incorporates all of the tasks and the people who will be responsible for them. When creating a Gantt chart, you’ll need to decide whether to use the critical path method or the critical chain method. The critical path method is the traditional approach to Gantt charting, while the critical chain method is a modern alternative. Whichever method you decide to use will depend on your project’s complexity and your preferences. The advantage of creating a Gantt chart is that it gives you a clear overview of how everything is related and when tasks are due. This will enable you to see what needs to be done at all times — and when.
Step 7: Add in your events and milestones
While you’re creating a Gantt chart, you may want to add in some milestones and events. This will enable you to see how certain events affect the progress of your project. It will also enable you to determine how much time you need between events. You may want to add holidays and weekends as well. This way, you can see how long your project will take without any interruptions. You can also use the Gantt chart to identify when you’re most productive. This will enable you to schedule important tasks during your most productive hours.
Step 8: Preview and publish your Gantt chart
After creating your Gantt chart, it is time to take a look at what you’ve created. In most cases, you will be able to find areas where you can speed up your project by optimizing your workflow. You can use the information contained in your Gantt chart to create a realistic schedule for your project. Be sure to share it with everyone who is involved in the project and keep it updated as things progress. This simple visualization tool is excellent for team planning. It allows you to see how everything is related, what’s estimated duration is, and when tasks need to be completed. This way, you can see how long your project will take without any interruptions.