 Project management is the process of planning, monitoring, and controlling a project from start to finish. Different projects require different processes, but most involve a lot of moving parts. Project management software can help you streamline your workflow so that you don’t have to rely on sticky notes and spreadsheets every five minutes. Effective visual aids can make your project management experience much more bearable. A Gantt chart is a type of bar chart that uses coloured bars to show the start and end dates of project tasks, how long they are expected to take (scope), and how many resources they’ll require. Let’s break it down further and see how Gantt charts can be used for project management.
What is a Gantt chart?
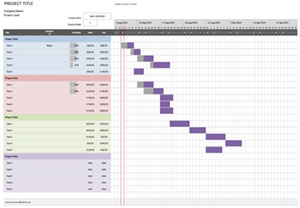
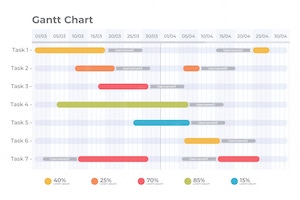
A Gantt chart is a type of bar chart that tracks project tasks from start to finish. The chart uses bars to represent each stage of the project, such as the discovery process, the design phase, etc. Each bar can also be colour-coded with an expected timeline for completion. Let’s say you’re managing a new website design project. In your Gantt chart, you might use vertical bars to show the different phases, like Design, Testing, and Deployment. Each bar would be colour-coded based on the duration, and the start and end dates would be clearly labelled. Gantt charts make it easy to see how each phase of the project relates to other phases. They can also be used as a template for creating a detailed project plan. They make excellent visual aids for keeping track of project tasks and milestones.
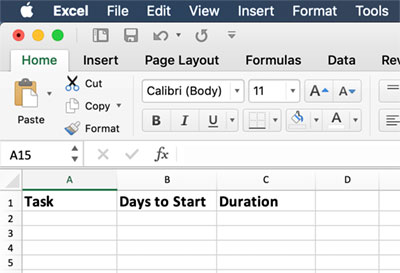
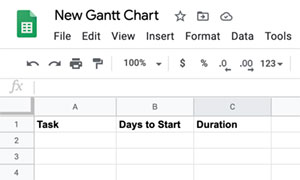
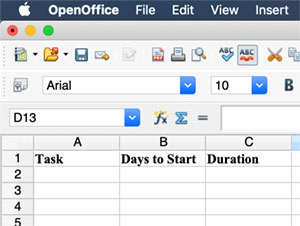
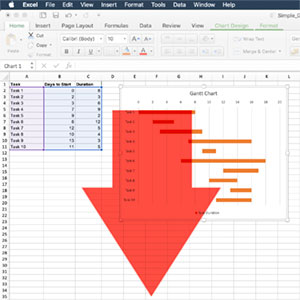
Many project management software programs come with a template for creating a Gantt chart, which makes it easy to start using this visual tool. To create a Gantt chart, you’ll need to list each task you’ll be working on during the project, from beginning to end. You can do this in a Word document or spreadsheet. Then, add Estimated dates for each task, and make sure you allow enough time for each one. Finally, create a timeline, and plot each task on the chart accordingly. Once you have your Gantt chart, you can use it to keep track of each team member’s responsibilities and due dates.
Why use a Gantt chart for project management?
There are a lot of reasons why Gantt charts are ideal for project management. For one thing, they’re incredibly visual. You can use different-coloured bars to show different phases or tasks. You can even use different shapes to visualize the progress of each task. So, if you have multiple tasks that have to be completed before the end of the project, you can see at a glance where you stand. Gantt charts make it easy to track progress and see what’s happening at any given moment. They also make it easy to identify any potential bottlenecks in your workflow. This can help resolve issues before they become major problems. Gantt charts are also great for visualizations. They make it easy to see how different parts of your project are related to one another. And they make it easy to identify potential areas of concern.
Gantt charts can be used for a number of other purposes as well. You can use them to show how long it will take to complete a given task, or how long it will take to complete the task. You can use Gantt charts to show the progress of your projects, or how much time you have left until you finish them.
Gantt charts are great for tracking tasks that are related together in some way (e.g., when one team member is working on a certain project). They're also great for tracking things that aren't related together - e.g., when one team member works on several different projects at once (e.g., one project involves multiple users and developers). The only downside with using Gantt charts is that they're not very useful if your team is so small that you don't have enough people working on each project individually - they're just too small not to be useful!
Pros of using a Gantt chart for project management
- Helps you stay organized throughout the project - A Gantt chart is a visual representation of your project as a whole. You can easily see where each task stands in relation to other tasks. This makes it easy to stay organized and prioritize your workload as the project progresses.
- Keeps you on track and allows you to easily identify issues - The whole process of managing a project is basically about making sure everything goes according to plan. Gantt charts make it easy to keep track of all of your tasks. They also make it easy to see if anything is out of place.
- Helps you identify potential bottlenecks - Gantt charts are also great for identifying bottlenecks. If you notice that a particular phase is taking longer than expected, you can investigate what’s causing the delay. You can then find ways to optimize your workflow and speed things up.
Cons of using a Gantt chart for project management
There are a few potential issues with the Gantt chart visualizations. One is that they are very visual, so they don’t include a lot of other important information. For example, you might notice that a particular task is taking longer than expected. But you wouldn’t necessarily know why it’s taking longer than expected. Another potential issue is that they don’t work well with projects that have a lot of unexpected developments. Gantt charts are great for projects with established start and end dates. But they aren’t so useful if your project is a little more unpredictable. Another potential issue is that Gantt charts don’t account for everything. They track your project tasks, but they don’t account for things like outside factors. For example, the team members who are responsible for the tasks. Since the chart doesn’t account for those factors, there’s no way to know if the team members are being productive.
How to Track Project Progress with a Gantt Chart
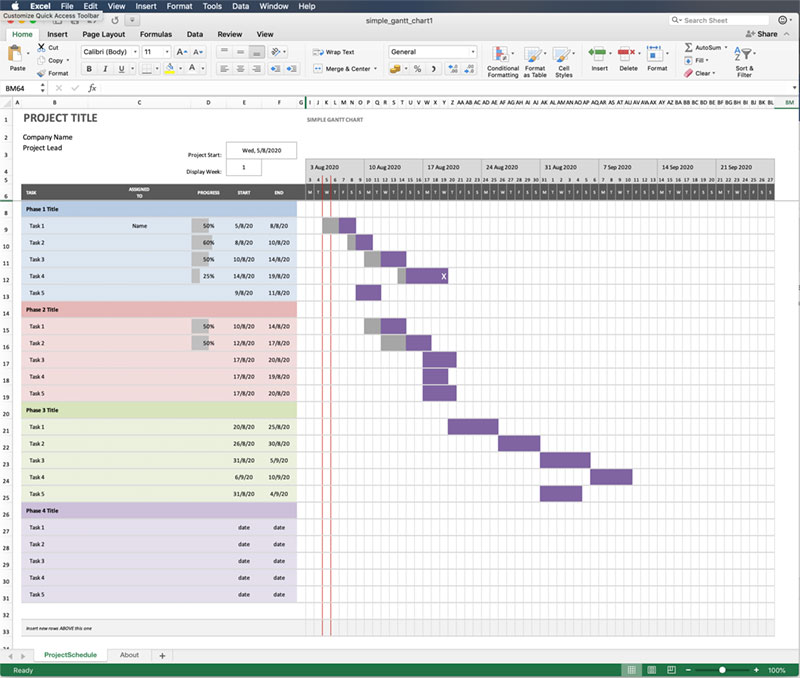
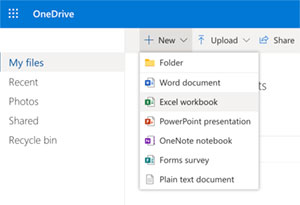
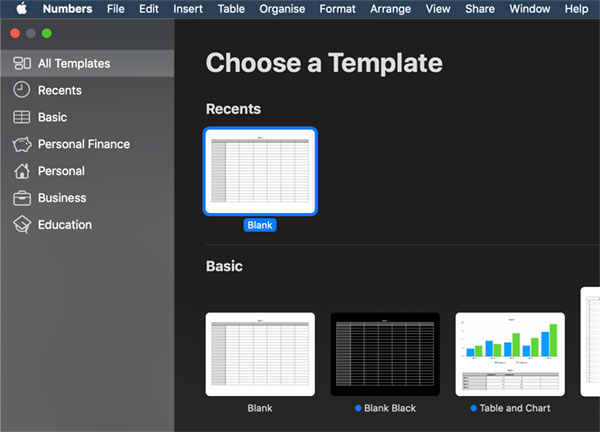
To track your project progress with a Gantt chart, you’ll first have to set up your chart. You can use online project management software for this, or you can create your Gantt chart manually. Even if you create the chart manually, you should use project management software to keep track of your actual project. Once your chart is set up, you’ll want to enter all relevant project data. You can set up project tasks with due dates, assign them to team members, and track their progress. Setting up project tasks will help you keep track of all your project details and keep the team on track with their responsibilities. At any time, you can view the status of each task to see how far along they are and when they are expected to be completed.
Setting up project tasks will also help you with project reporting and documentation. With everything logged in one place, it’s easier than ever to keep track of your progress and see where you might need to make adjustments. This includes the project start and end dates, the names of your team members, and the names of any contractors or freelancers who will be working on the project. You’ll also want to enter the names of your project tasks and their expected durations and scopes.
Using a Gantt Chart for Time Management
Gantt charts are a great tool for time management. A Gantt chart is a chart that shows you how long it will take to do something. It’s a graph that shows how much time is needed to complete tasks. You can set up a Gantt chart with multiple times and dates on one side, and then change the order of the times to make your task appear as if you’re working on it at different times based on what’s required at each time. You can also change the colour of the timeline to show which tasks are being completed.
Gantt charts are extremely useful when working with projects as they help you stay organized and track your progress because you have all the data you need in one place. The best thing about setting up a Gantt chart is that it’s not difficult to use and can be done quickly with just a few simple steps.
Limitations of Gantt charts
Gantt charts are great for visualizing project tasks, durations, and scopes, but they don’t do a great job with other important information. For example, they don’t show budget information. They also don’t show how the different tasks are interrelated. As we mentioned earlier, Gantt charts don’t account for things like outside factors. So, they don’t give you any information on how productive your team members are. They also don’t account for any issues that arise. This can make it difficult to identify those issues and resolve them. Gantt charts are also only useful for projects that have clear start and end dates. They aren’t useful for projects that are expected to go on indefinitely.
Conclusion
Gantt charts are very effective visual aids for project management. They make it easy to visualize project tasks and progress. They also make it easy to identify potential bottlenecks and issues. That being said, Gantt charts don’t account for everything. They don’t show budget information, and they don’t account for issues or unexpected developments. They also aren’t useful for projects that don’t have a clear start and end date. Despite these limitations, Gantt charts are still an effective way to manage projects. They make it easy to see how each phase of a project relates to other phases. They also make it easy to track progress and identify potential issues.