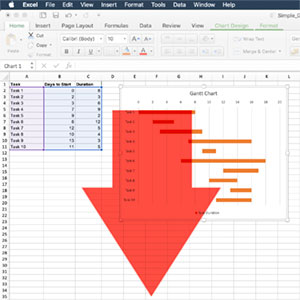
 Managing the tasks associated with a project is made much easier using a Gantt Chart. The Gantt Chart will bring together all the required tasks for completion, the timings, relationships and interdependencies in a single chart with tasks represented by bars.
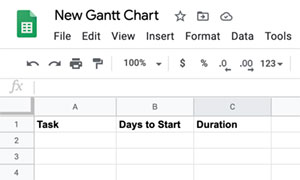
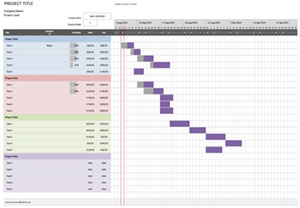
Components of a Gantt Chart
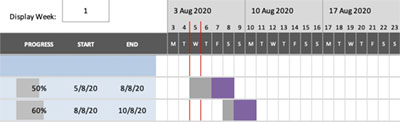
Dates / Timings
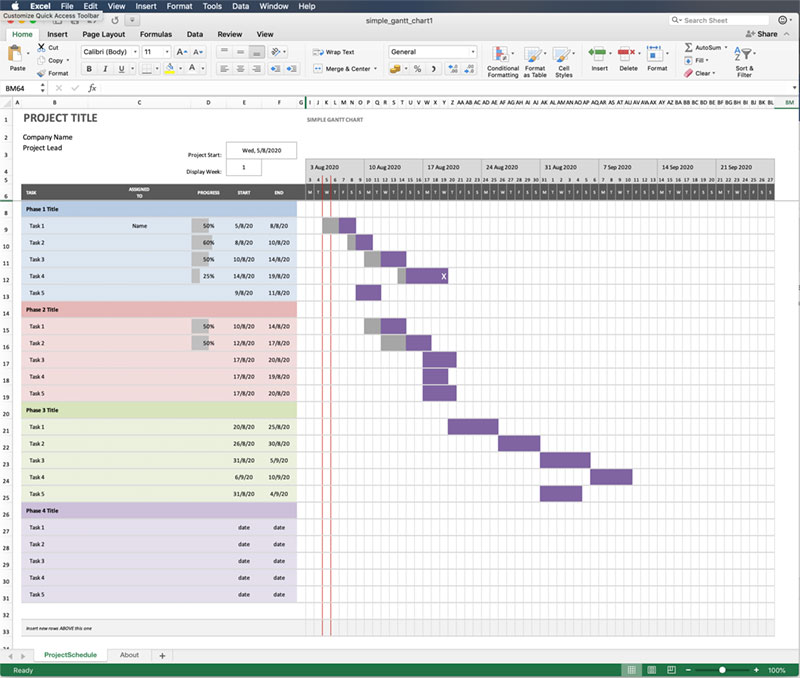
The most important feature of the Gantt Chart is to show the dates of tasks beginning and ending, the duration relative to other tasks and the relationships in time, allowing forward planning. These are usually shown across the top of the chart and represent the entire project from start to finish.
Project Tasks
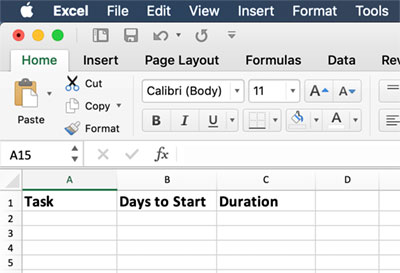
Every project using a Gantt Chart will have a number of tasks, and sub-tasks, that need to be completed in a specific order, with some dependent on others to finish before starting themselves. Project tasks are shown down the left side of the chart.
Task Bars
With the project tasks listed vertically on the left, and the project dates or timings listed along the top, the tasks can be represented by bars showing the planned start and end dates, allowing the relationships to be seen at a glance over the course of the project.
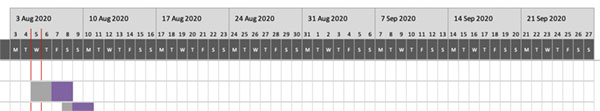
Project Milestones
Major points in the project that may represent a particular milestone, or important completion of a project phase, can be shown by marking the task bar with a diamond or other shape.
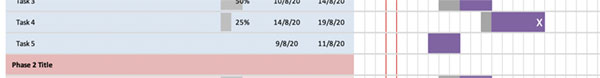
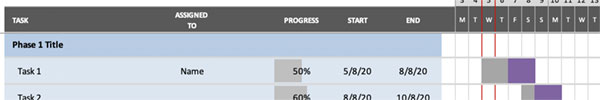
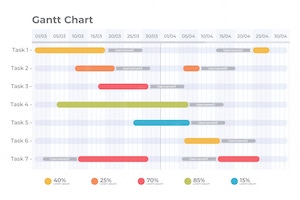
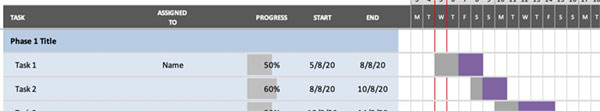
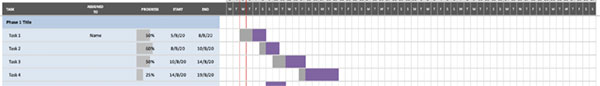
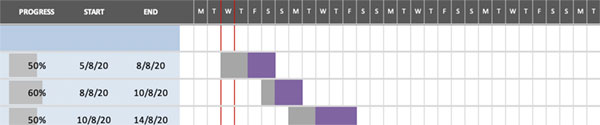
Task Progress
Multiple tasks can be being worked on at the same time and some may take a lot longer than others, and the progress being made may not linear but may happen in phases between the start and end dates of the task. Therefore it can be very useful to show the percentage of the task competed by changing the colour or shading on the task bar.
Dependency Arrows
The beginning of some tasks may be dependent on the finishing of other tasks, and the relationship is usually represented by arrows between the task bars.
Current Date Progress Line
The current date is often shown as a vertical line on the Gantt Chart making it easy to see at a glance the status and dependencies of tasks in relationship to the current date.
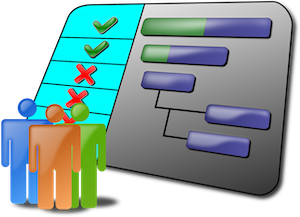
Resource Allocation
While not necessary for all projects it can be very useful for some to show what resources, be that people, tools or supplies, are assigned to a task.