 The Gantt chart, a time-tested tool in the world of project management, has experienced a remarkable transformation over the past century. From its early days as a paper-based chart to its modern incarnation as an integral part of project management software, the Gantt chart has continually adapted to the changing technological landscape. This article will take you on a journey through the evolution of Gantt charts as they transitioned from paper to digital, highlighting key milestones along the way and exploring the impact of this shift on the field of project management.
The Paper Era: Gantt Charts in the Early Days
Invented by Henry L. Gantt in the 1910s, the Gantt chart was initially designed as a paper-based visual representation of project schedules. By using horizontal bars to represent tasks and their durations, Gantt charts provided an intuitive way to manage complex projects, such as railroad construction and large-scale infrastructure projects.
Throughout the first half of the 20th century, Gantt charts were primarily drawn and updated by hand, making them labor-intensive and susceptible to human error. Nevertheless, they proved invaluable in various industries, including construction, manufacturing, and military operations during World War I and World War II.
The Dawn of Computers: Early Gantt Chart Software
The advent of computers in the 1950s and 1960s brought about significant advancements in project management, including the digitization of Gantt charts. Early project management software, such as the Program Evaluation and Review Technique (PERT) and the Critical Path Method (CPM), began to incorporate Gantt chart functionality, allowing for easier creation, modification, and analysis of project schedules. These early software solutions were mostly available on mainframe computers, which limited their accessibility to large organizations with substantial resources.
The Personal Computer Revolution and Gantt Charts
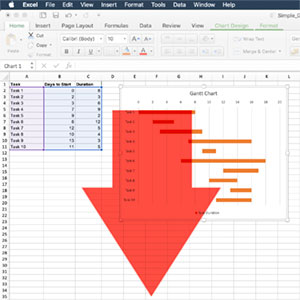
With the widespread adoption of personal computers in the 1980s, Gantt chart software became more accessible to businesses of all sizes. Microsoft Project, first released in 1984, was one of the earliest project management tools available for personal computers, integrating Gantt chart functionality and offering users an intuitive interface for managing project schedules.
The personal computer revolution also facilitated the development of specialized Gantt chart software, catering to the unique needs of various industries. These tools became increasingly user-friendly, allowing project managers to create and edit Gantt charts with greater ease and efficiency.
The Internet Age: Collaboration and Cloud-Based Gantt Charts
The rise of the internet in the 1990s and early 2000s brought about a new era of connectivity and collaboration in project management. Gantt chart software began to adopt web-based and cloud-based architectures, enabling teams to access and update project schedules from anywhere with an internet connection.
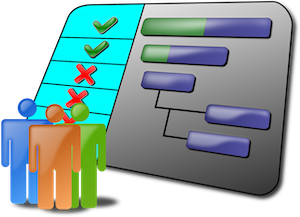
This shift towards online Gantt charts facilitated real-time collaboration, with multiple team members able to work on a project simultaneously. Project managers could now easily share Gantt charts with stakeholders, streamlining communication and improving overall project visibility.
Modern Project Management Software and Gantt Charts
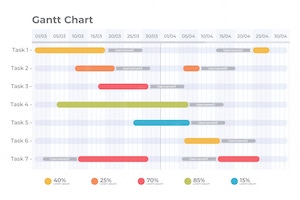
Today, Gantt charts are an integral component of modern project management software, available in a wide range of solutions tailored to various industries and needs. From web-based platforms like Trello and Asana to more specialized tools like Smartsheet and Basecamp, Gantt chart functionality has become a staple feature in contemporary project management tools.
In addition to seamless collaboration, modern Gantt chart software offers a host of advanced features, such as resource allocation, critical path analysis, and progress tracking. These capabilities not only help project managers stay on top of their work but also provide valuable insights into potential bottlenecks and opportunities for improvement.
The Future of Gantt Charts in the Digital Age
As technology continues to advance, we can expect Gantt charts to evolve alongside emerging trends and innovations. Artificial intelligence (AI) and machine learning have the potential to further enhance Gantt chart capabilities, enabling even more accurate project scheduling and resource allocation. Additionally, the growing popularity of virtual and augmented reality could lead to new ways of visualizing and interacting with Gantt charts, offering immersive experiences that facilitate better understanding and decision-making.
Conclusion
The journey of Gantt charts from paper to digital reflects the broader evolution of project management tools and techniques. As Gantt charts have transitioned into the digital realm, they have become more versatile, efficient, and collaborative, cementing their place as a vital instrument in modern project management.
As we look to the future, it's clear that Gantt charts will continue to adapt and grow alongside new technologies and emerging ways of working. By embracing this ongoing evolution, project managers can harness the power of Gantt charts to better navigate the complexities of an ever-changing world, ensuring the successful completion of projects across various industries and contexts.
In summary, the digitization of Gantt charts has revolutionized the way we manage projects, enabling greater flexibility, collaboration, and efficiency in project management processes. From humble beginnings as a paper-based tool for managing railroad construction to their current status as a vital component of modern project management software, Gantt charts have come a long way, proving their worth and adaptability time and time again. As we continue to develop innovative solutions and explore new technologies, the Gantt chart will undoubtedly remain a key instrument in helping us to successfully plan, execute, and deliver projects in the ever-evolving world of work.