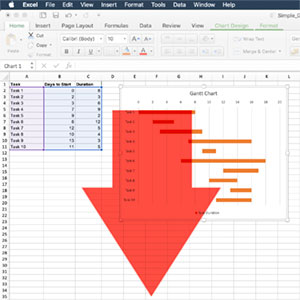
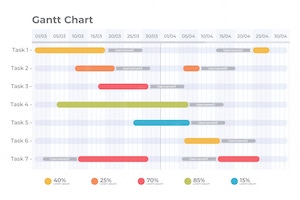
Expensive, dedicated software isn't required to produce a simple, and useful, Gantt Chart, for many small projects. Widely available spreadsheet software, such as Excel, can be used to produce a Gantt Chart using the standard rows and columns for data entry, a stacked bar chart, and some easy formatting.
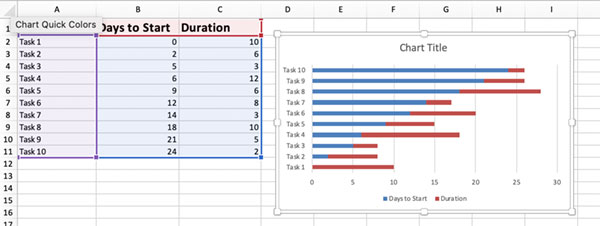
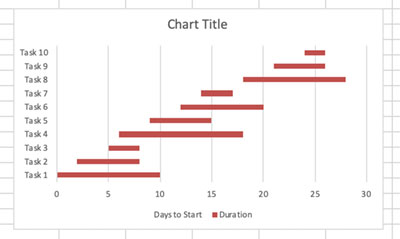
The basis for the Gantt Chart in Excel is to use a stacked bar chart format with two data sets, the days from the start of the project to the start of the task, and the days required for the task. By changing the colour of the first part of the stacked bar then the result looks like the usual task bar in a Gantt Chart. Neat trick!
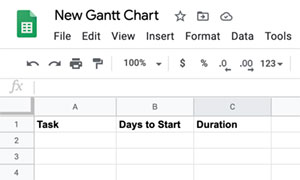
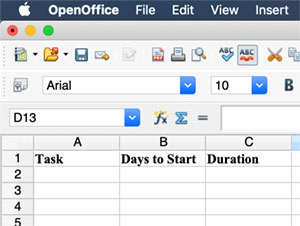
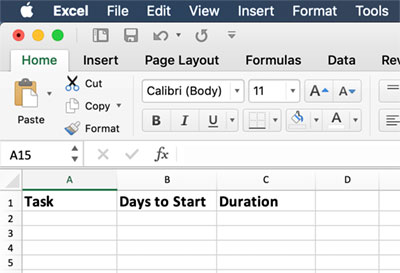
Step 1 - Start the table
Create the table by adding column headers for Tasks, Days to Start & Duration. Format the headers as required.
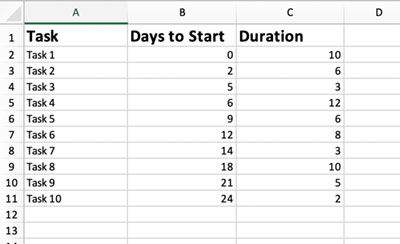
Step 2 - Add the task data to the table
Add the details of tasks, when they are planned to start in days from the beginning of the project, and the expected duration in days. These values can be adjusted later as needed, and even values (tasks) inserted between others or added on.
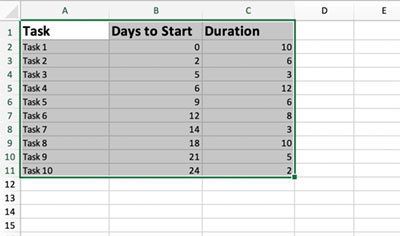
Step 3 - Select all of the table created
Drag over the cells to highlight everything from the headers to the end of the data.
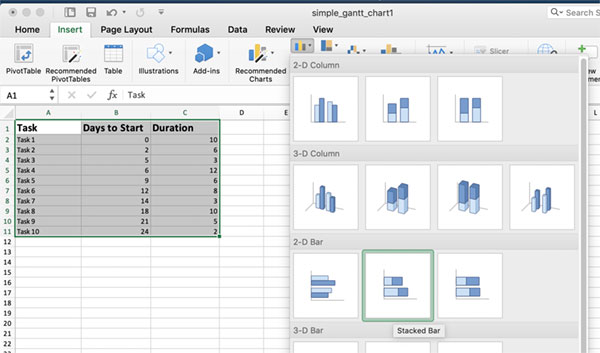
Step 4 - Insert a Stacked Bar Chart
Go to the Insert menu tab on the top bar, click on the Column icon to open the drop down. In the 2-D Bar row select the Stacked Bar chart type.
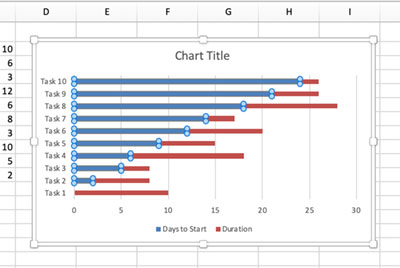
Step 5 - Format the bars
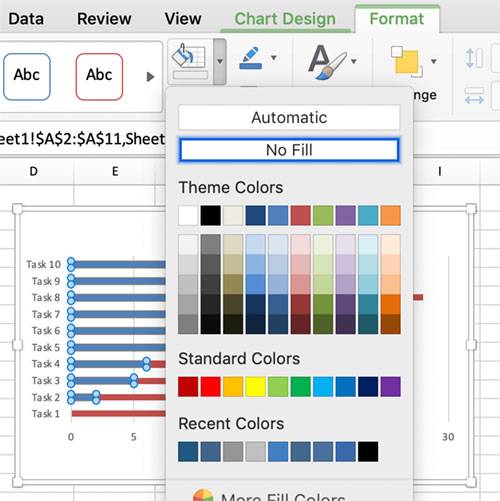
Select the first data series on the chart (the Days to Start part) which are blue in the example. Then select the Format tab at the top and select the Shape Fill option icon arrow to open the dialogue box, and then select No Fill. This will make the blue colour disappear leaving just the Duration element of the bar as in a Gantt Chart.
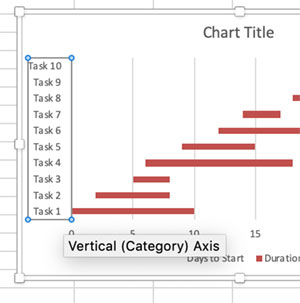
Step 6 - Set Tasks to the correct order
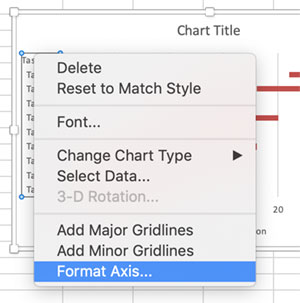
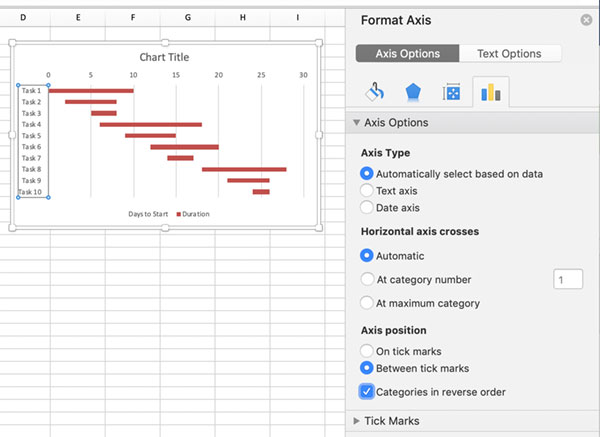
By default the chart will have the Tasks in the wrong order, starting with last at the top. Select the Tasks column by clicking on it, then either use the very top menu bar Format option and Format Selection from the dropdown, or right click on the selection and select Format Axis... Both methods will open the side Format Axis options. Select Categories in reverse order checkbox to make the Tasks display in the correct order.
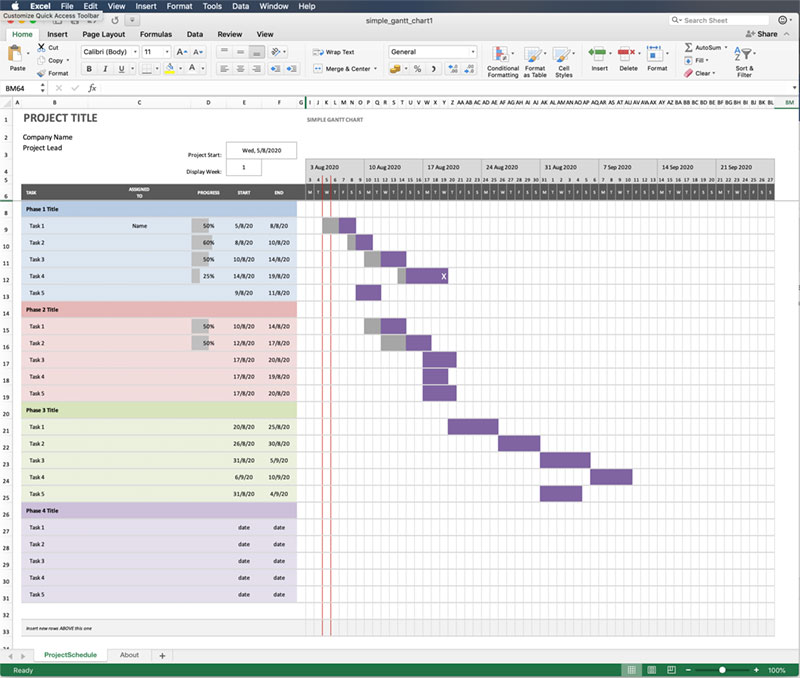
The Gantt Chart can be further customised as needed by removing or changing the titles, or adjusting the colours etc.
Download the example Simple Gantt Chart in Excel.