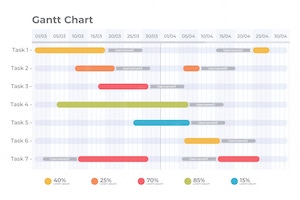
 Gantt charts are important and useful tools in project planning including the scheduling of tasks and resources, and have a long history of use spanning more than 100 years.
The development of what are now known as Gantt Charts begins around the end of the 19th Century and beginning of the 20th Century. Building on the previous development of bar charts in the 18th Century it is usually recognised that Karol Adamiecki, an engineer in Poland, created the harmonogram in 1896, describing it to the Society of Russian Engineers in 1903, which became the precursor to the Gantt Chart.
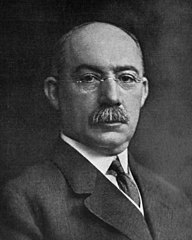
Henry Gantt (1861–1919), was a mechanical engineer and management consultant in America. He attended the McDonogh School and Johns Hopkins University, and taught at McDonogh School for three years before attending the Stevens Institute of Technology in New Jersey, graduating with a Masters of Engineering degree in mechanical engineering. Gantt then worked for Poole & Hunt in Baltimore as a draughtsman before working at Midvale Steel and Bethlehem Steel, applying scientific management principles until 1893, and later become an industrial consultant. He initially created the Gantt General Control Production Chart used in factories for planning the manufacturing orders.
In Germany Hermann Schürch is known to have published charts, similar to Gantt Charts, about a construction project but without showing interdependencies in 1912 and may have been commonly used at that time.
Henry Gantt designed and published his charts around 1910–1915 where they became used by General William Crozier, a United States Army Officer of the Ordnance Corps, in World War 1.
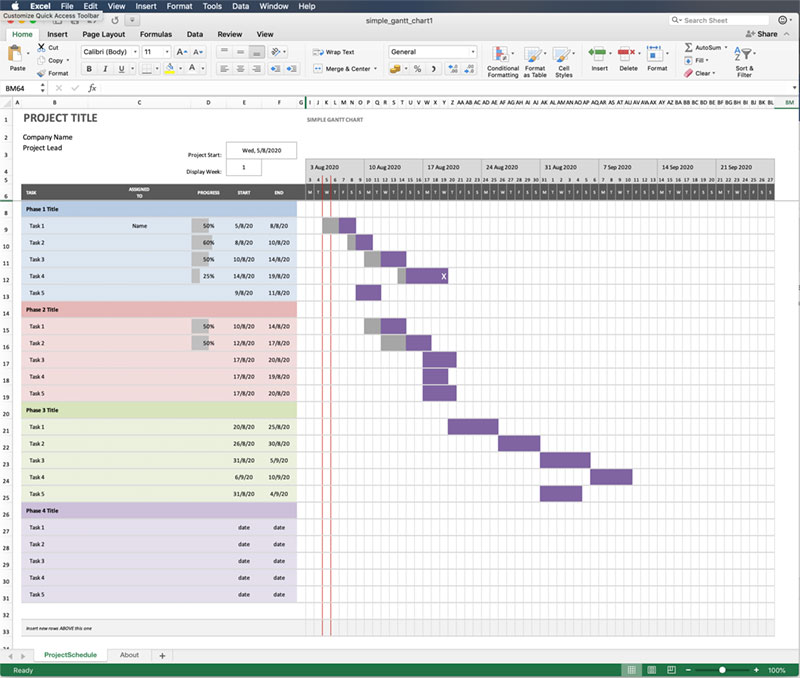
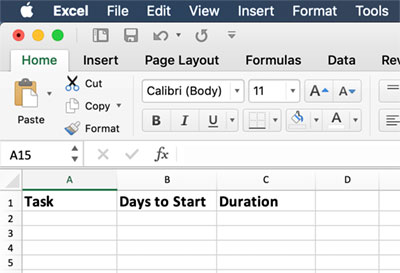
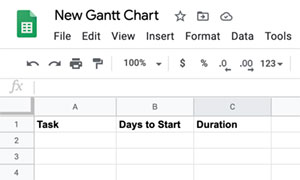
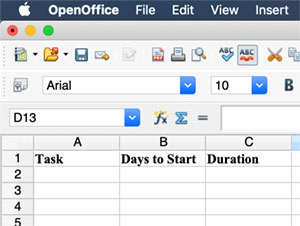
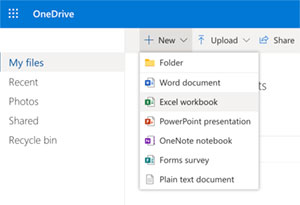
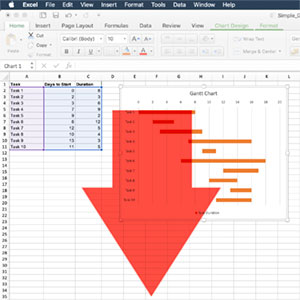
Before the introduction of computers Gantt Charts were drawn on paper and would have used pieces of paper or blocks to represent the chart bars so they could be adjusted without redrawing the entire chart if the project planning required changes. With the rise of computers the entire process has become digital using either a spreadsheet or dedicated software.