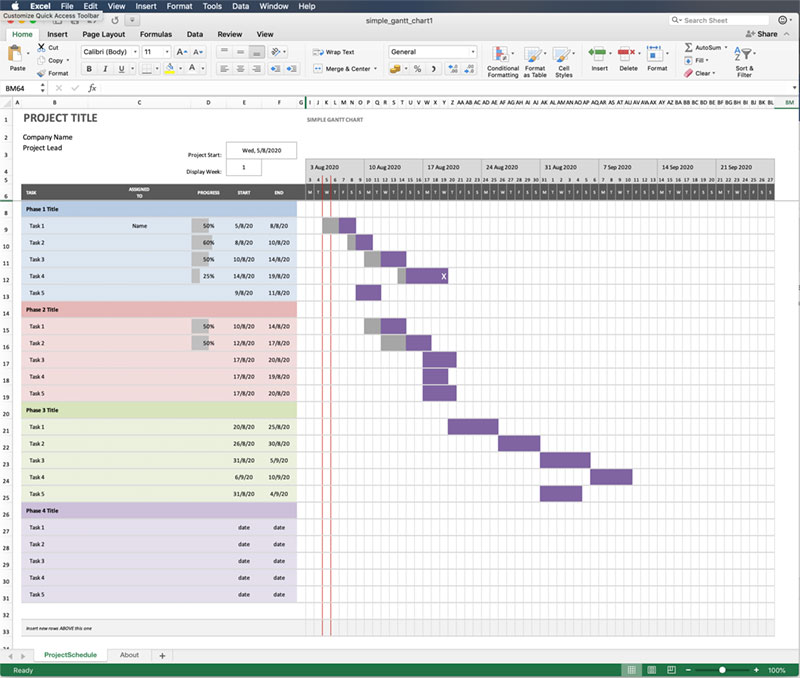
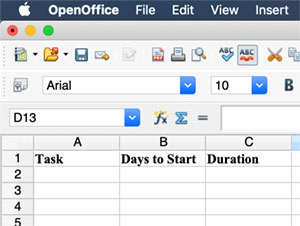
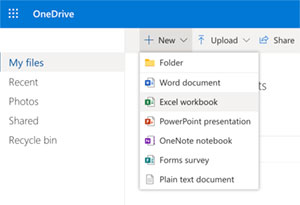
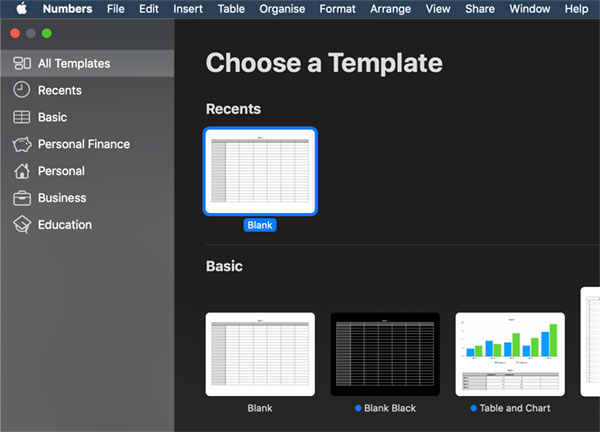
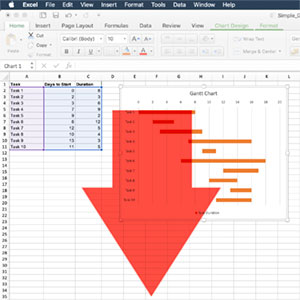
There is dedicated software available to create and edit Gantt Charts with a range of features useful when the chart required is for a complex project. Gantt Charts are essentially simple, with rows and columns representing tasks on the side and dates or timings along the top, with bars showing the tasks relationships to start and end dates, and other tasks within the project. These rows and columns are the basic construction of a spreadsheet, such as Excel, OpenOffice, or Google Sheets. Any spreadsheet software or online spreadsheet version can be used to create a simple Gantt Chart. Here we start by looking at using MS Excel to create a simple Gantt Chart.
Using MS Excel to Create a Simple Gantt Chart
Microsoft Excel is a versatile tool that can be used for various tasks, including creating simple Gantt charts. In this article, we will guide you through the process of creating a Gantt chart using MS Excel, making project management and planning easier for you without needing specialized software.
Why Use MS Excel for Gantt Charts?
While there are dedicated project management tools for creating Gantt charts, using MS Excel can be a cost-effective and convenient alternative for smaller projects or individuals who already have access to the software. Excel offers flexibility in customization, and its familiar interface makes it easier for users to create and modify their Gantt charts.
Preparing Your Data
Before creating your Gantt chart, you need to organize your project data. Here's what you should prepare:
- Task List: List all tasks required to complete your project.
- Start Date: Determine the start date for each task.
- Duration: Estimate the duration (in days) required to complete each task.
- End Date: Calculate the end date for each task based on the start date and duration.
- Dependencies (optional): Identify any dependencies between tasks.
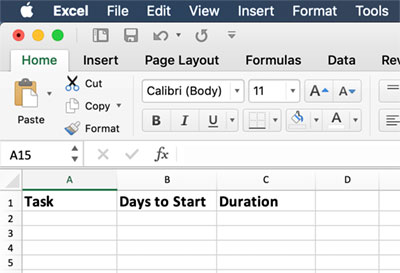
Creating a Simple Gantt Chart in Excel Follow these steps to create a Gantt chart in Excel:
Step 1: Enter your data
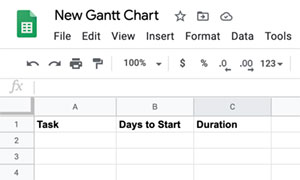
- Open a new Excel workbook and enter your prepared data into columns A-D (Task List, Start Date, Duration, and End Date).
Step 2: Create a stacked bar chart
- Select the data in columns B, C, and D (Start Date, Duration, and End Date).
- Navigate to the "Insert" tab and click "Insert Bar Chart," then select "Stacked Bar."
Step 3: Format the chart
- Right-click the series representing the Start Date (the leftmost section of the bars) and select "Format Data Series."
- In the "Fill & Line" section, set the fill color to "No Fill" to make the Start Date portion invisible.
- Adjust the horizontal axis to display dates by right-clicking on it and selecting "Format Axis." Change the "Minimum" and "Maximum" values under the "Bounds" section to match your project timeline.
Step 4: Add task labels
- Click on the chart to activate the "Chart Design" tab. Click "Add Chart Element" and select "Data Labels," then "Inside Base" to add labels to the bars.
- To display task names instead of dates, click on a label, then click the formula bar and type "=A2" (replace "2" with the corresponding row number of the task). Repeat this for all tasks.
Customizing Your Gantt Chart You can customize your Gantt chart by:
- Changing bar colors to differentiate tasks or phases.
- Adding milestones as markers on the chart.
- Creating a separate Gantt chart for each project phase or team.
- Inserting additional columns to include resources or status information.
Tips for Maintaining Your Excel Gantt Chart
- Update your Gantt chart regularly to ensure accurate progress tracking.
- Use conditional formatting to highlight tasks that are behind schedule or completed.
- Share your Gantt chart with team members to improve communication and collaboration.
Conclusion
Creating a Gantt chart in MS Excel is a practical and efficient way to manage smaller projects or for individuals who prefer a familiar tool. By following the step-by-step guide provided in this article, you can easily create a simple Gantt chart and customize it to suit your project's needs. With regular updates and sharing with team members, an Excel-based Gantt chart can become an effective project management tool, helping you stay organized and on track throughout your project's lifecycle.