 Project management methodologies are essential for ensuring the smooth and successful execution of a project. Among the numerous tools and techniques available to streamline these methodologies, Gantt Charts stand out as an exceptional aid. In this article, we will explore various project management methodologies and how Gantt Charts can be seamlessly integrated into these approaches to improve project outcomes.
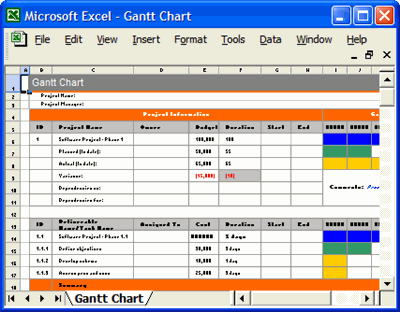
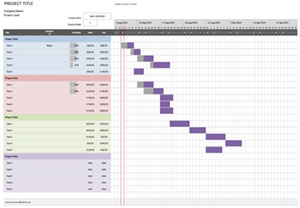
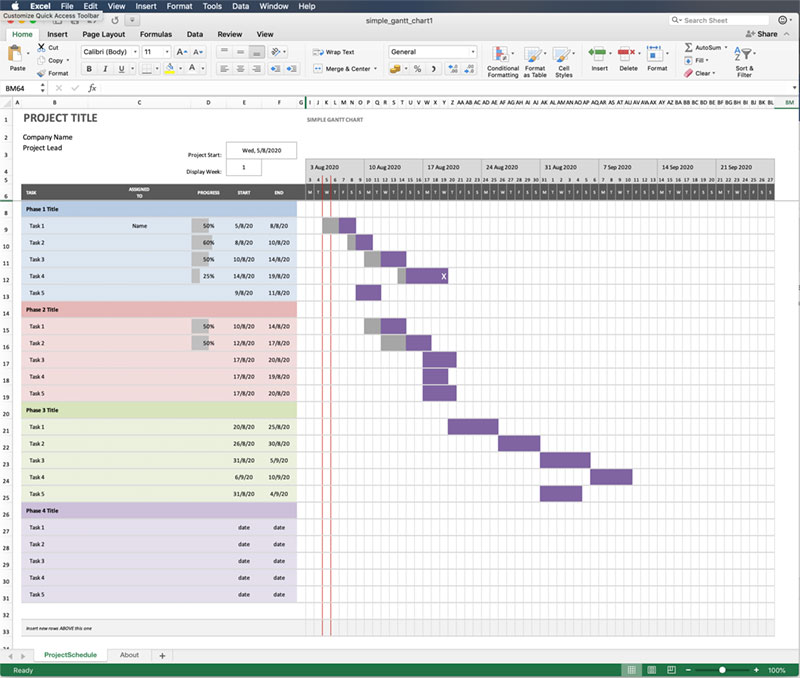
Gantt Chart Overview
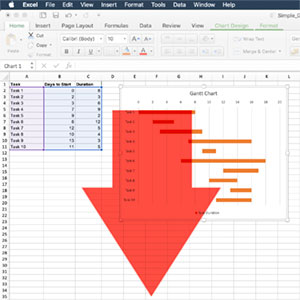
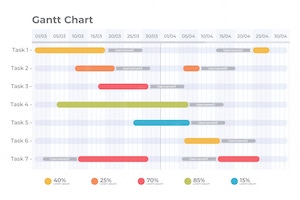
Gantt Charts are horizontal bar charts that visually display a project schedule. Created by Henry L. Gantt in the early 20th century, these charts have become an indispensable tool for project managers worldwide. Gantt Charts illustrate the start and end dates of individual tasks, as well as the relationships between them, allowing project managers to efficiently monitor progress and resource allocation.
Project Management Methodologies and Gantt Chart Integration
Waterfall Methodology
The Waterfall methodology is a traditional linear approach to project management, where a project is divided into sequential phases, such as planning, design, development, testing, and deployment. Each phase must be completed before the next can begin, and there is little room for flexibility.
Gantt Chart Integration: Gantt Charts are well-suited for the Waterfall methodology, as they can clearly display the sequential nature of the project phases. By illustrating the dependencies between tasks, Gantt Charts help project managers track progress and ensure that deadlines are met. Additionally, they can highlight any bottlenecks or delays, enabling project teams to make adjustments to get back on schedule.
Agile Methodology
Agile is an iterative and adaptive approach to project management, emphasizing collaboration, flexibility, and customer feedback. The Agile methodology divides a project into smaller tasks or "sprints," with each sprint usually lasting two to four weeks.
Gantt Chart Integration: While Agile methodologies typically rely on other tools like Kanban boards or Scrum boards, Gantt Charts can still be useful in tracking overall project progress. By creating a high-level Gantt Chart with sprints as milestones, project managers can monitor the completion of sprints and adapt the schedule as needed. Gantt Charts can also be used to plan and visualize long-term goals or releases, complementing the iterative nature of Agile methodologies.
Critical Path Method (CPM)
The Critical Path Method is a project management technique used to identify the longest sequence of tasks in a project, referred to as the "critical path." By focusing on the critical path, project managers can optimize resource allocation and ensure that the project is completed within the shortest possible time.
Gantt Chart Integration: Gantt Charts are an excellent tool for visualizing the critical path in a project. By highlighting the critical path tasks and their dependencies, project managers can easily identify which tasks need immediate attention and prioritize them accordingly. This not only helps in managing resources effectively but also in proactively addressing potential delays and mitigating risks.
PRINCE2 Methodology
PRINCE2 (Projects IN Controlled Environments) is a widely recognized process-driven project management methodology that emphasizes planning, monitoring, and controlling project stages. This method is often used in large-scale, complex projects and is characterized by its focus on business justification, clear roles and responsibilities, and continuous improvement.
Gantt Chart Integration: Gantt Charts can be employed to plan and monitor project stages and their associated tasks in a PRINCE2 environment. By assigning roles and responsibilities to each task, Gantt Charts can help project managers ensure that team members are aware of their accountabilities. Moreover, Gantt Charts can be used to track progress against baselines, allowing for continuous improvement and adjustments to maintain alignment with business objectives.
Lean Project Management
Lean project management is an approach that focuses on reducing waste and increasing efficiency by identifying and eliminating non-value-adding activities. This method is built on the principles of the Lean manufacturing system and is designed to streamline processes and optimize resource utilization.
Gantt Chart Integration: Gantt Charts can be used in Lean project management to visualize the flow of tasks and identify areas of waste, such as bottlenecks or resource overallocation. By providing a clear view of the project timeline and dependencies, Gantt Charts enable project managers to make data-driven decisions and implement Lean principles effectively. This leads to improved efficiency and minimized waste throughout the project lifecycle.
Conclusion
Gantt Charts are a versatile and powerful tool that can be integrated into various project management methodologies. Whether it's the traditional Waterfall method, the flexible Agile approach, or the efficiency-focused Lean method, Gantt Charts have a role to play in helping project managers plan, monitor, and control project tasks.
By incorporating Gantt Charts into these methodologies, project managers can ensure better visibility, improved communication, and more effective resource allocation, ultimately leading to increased project success rates. Therefore, regardless of the methodology employed, Gantt Charts can undoubtedly enhance project management practices and contribute to the successful completion of projects.