 The Gantt chart, a familiar tool for project managers worldwide, boasts a fascinating history that dates back over a century. This versatile tool has evolved from its humble beginnings, assisting in railroad construction, to becoming a vital component of modern project management software. In this article, we'll explore the origins of the Gantt chart, its development over time, and how it has revolutionized the way we work.
The Birth of the Gantt Chart
The Gantt chart was created by Henry L. Gantt, a mechanical engineer and management consultant, in the 1910s. Gantt was inspired by the need for a more efficient way to manage complex projects, particularly those involving the construction of railroads. His solution was a visual representation of a project schedule, using horizontal bars to display the duration of individual tasks and their relationships to one another.
The Gantt chart quickly gained popularity in the United States as a practical tool for coordinating resources and monitoring project progress. In 1917, the Hoover Dam project adopted Gantt charts, and their successful application in this massive endeavor cemented their reputation as an essential project management instrument.
The Gantt Chart in Wartime
During World War I and World War II, Gantt charts played a crucial role in managing resources and organizing production processes. Governments and military leaders recognized the value of this tool in optimizing the allocation of resources, reducing waste, and ensuring that materials and personnel were available when needed. For example, shipyards in the United States used Gantt charts to streamline the construction of vessels, contributing to the overall war effort.
In the post-war period, Gantt charts continued to be a valuable tool for managing large-scale projects, such as the construction of highways and the development of aerospace technology. As industries grew and projects became more complex, the need for efficient project management became even more apparent.
The Digital Revolution and Gantt Charts
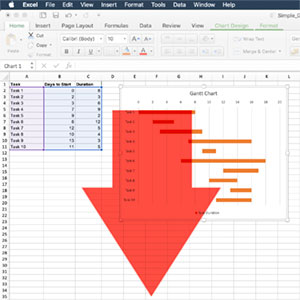
The advent of computers and digital technology in the latter half of the 20th century marked a significant turning point for the Gantt chart. As project management software emerged, the Gantt chart transitioned from paper to digital formats, enabling more dynamic and interactive representations of project schedules.
This digital shift made it easier to update and modify Gantt charts, allowing for real-time adjustments and improved collaboration among team members. With the integration of Gantt charts into software like Microsoft Project, project managers could now access a powerful suite of tools to manage projects with greater accuracy and efficiency.
The Gantt Chart Today
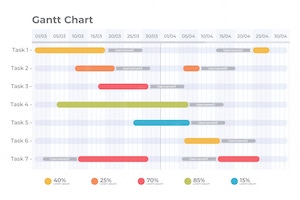
Today, Gantt charts remain a cornerstone of project management, with a wide variety of software solutions available to suit different needs and industries. From construction and engineering to software development and marketing, Gantt charts have become an indispensable tool for managing projects of all shapes and sizes.
Modern Gantt charts offer a host of advanced features, such as resource allocation, critical path analysis, and progress tracking. These capabilities not only help project managers to stay on top of their work, but also provide valuable insights into potential bottlenecks and opportunities for improvement.
Conclusion
From its inception as a tool for managing railroad construction to its integration into sophisticated project management software, the Gantt chart has come a long way over the past century. This enduring tool has proven its worth time and time again, demonstrating its adaptability and relevance in an ever-changing world.
As we look to the future, it's clear that the Gantt chart will continue to evolve alongside emerging technologies and new ways of working. With the rise of artificial intelligence, machine learning, and big data, we can expect further enhancements to Gantt chart capabilities, making them even more powerful and responsive to project management needs.
Ultimately, the Gantt chart's rich history and ongoing evolution serve as a testament to its enduring value in the field of project management. As a tool that has stood the test of time, the Gantt chart remains a vital instrument for organizing, coordinating, and executing projects across a wide range of industries. Its fascinating journey from railroads to software is a reflection of our own progress, as we continue to develop innovative solutions to help us navigate the complexities of an ever-changing world.